September 21st, 2015

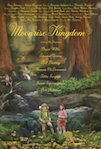
This week's list is led by Pitch Perfect 2, which was a surprisingly strong performer at the box office. However, its reviews are not up to Pick of the Week levels. The best of the best are dominated by TV on DVD releases, including Modern Family: Season 6, which is the last sitcom I watch every single week. However, it is a double-dip that wins the Pick of the Week honors, Moonrise Kingdom:Criterion Collection. The original Blu-ray didn't have nearly enough extras, but this one corrects that problem.
More...
February 24th, 2013
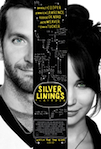
Independent Spirit Award were handed out yesterday and while the average moviegoer will be more focused on the Oscars tonight, a lot of great films were honored yesterday. This includes Silver Linings Playbook, which took home numerous awards, including the top prizes.
The categories and winners are...
More...
February 21st, 2013
With our annual Oscar Prediction contest underway, now is the best time to look at the nominees and try and figure out who the favorites are and which films should just feel honored to be nominated. Today we will look at the two writing categories, finishing with Best Original Screenplay. There are actually three films that could win that and it wouldn't be a total shock if they did. That said, there is still a favorite to contend with.
More...
February 19th, 2013
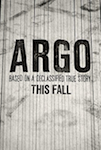
Argo continues its winning ways at the WGAs this weekend. It has become the defacto favorite for the Oscars, despite the high profile Oscar snub.
More...
January 10th, 2013
The Oscar nominations were announced this morning, and there's certainly a lot to talk about. There are some nominations that should surprise no one. For instance, Lincoln led the way with twelve nominations, and it has been seen as the major contender for a long time. However, there were also a few surprise nominations and some major snubs. Here are the list of nominations, and some reactions.
More...
January 7th, 2013
Surprises seems to be the word of the day, as the WGA nominations included a number of them. Granted, Zero Dark Thirty and a lot of the other films that have earned Awards Season success thus far were here, but there were almost as many surprises as there were obvious choices.
More...
January 6th, 2013
Producers Guild of America announced their nominations this week, including the three theatrical categories. There were a number of films on the list that have been mentioned time and time again this awards season, like Zero Dark Thirty, but there were also a few surprises.
More...
December 15th, 2012
We are getting closer and closer to Christmas and we are getting to the crunch time for gift shopping. After checking out first run releases and franchise box sets in Part I and TV on DVD releases in Part II, this week we look at limited releases, classics, and foreign films. Some are pretty obvious choices, as we had a few limited releases that broke into the mainstream during their theatrical releases, but there are also a few more films that slipped beneath the radar the last time around. The biggest of these is...
More...
December 13th, 2012
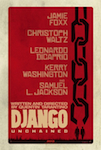
The Hollywood Foreign Press Association announced their nominations and the same list of films that have been mentioned since the beginning of Awards Season were rewarded today. Lincoln led the way with seven nods, while Argo and Django Unchained were close behind with five.
More...
November 28th, 2012
The Independent Spirit Awards has a special place in the Awards Season. The nominations are the unoffficial start of Awards Season, but the actual awards aren't given out until Oscar weekend, so they are the beginning at the end of Awards Season. They also help out a lot of limited releases that would otherwise not get enough buzz, although they are not so good at predicting Oscar wins. This year, two films tied for most nominations, Moonrise Kingdom and The Silver Linings Playbook, both of which earned five nominations. They weren't the only films to earn multiple nominations though.
More...
November 5th, 2012
Madagascar 3: Europe's Most Wanted was one of seven new releases to reach the top 20 on this week's Blu-ray sales chart. It took first place with 768,000 units / $15.36 million for an opening week Blu-ray share of 45%. This is good for a digitally animated kids movie. In fact, this wouldn't be bad if it were an action film.
More...
November 5th, 2012
Madagascar 3: Europe's Most Wanted lived up to its name becoming the best selling new release and earning first place on the DVD sales chart. The film sold 944,000 units and generated $16.03 million in revenue, which was easily enough for first place.
More...
October 16th, 2012
It's a mixed week on the home market. Granted, Madagascar 3: Europe's Most Wanted is coming out, which made more than $200 million domestically and should sell quite well on the home market. On the other hand, the second biggest first run release is That's My Boy, which failed to make an impact at the box office. There is also a flood of weaker releases, secondary Blu-ray releases, and Christmas releases, much of which I would consider filler. The signal to noise ratio is a little off. As for the best releases of the week, there are some great TV on DVD releases like Mad Men: Season Five and Degrassi: Season 11, Part 2. There are also some limited releases, like Moonrise Kingdom on Blu-ray Combo Pack and even some Direct-to-DVD releases, like Excision on Blu-ray. All of these were contenders for Pick of the Week. In the end I went with Mad Men: Season Five for Pick of the week, while Degrassi: Season 11, Part 2 earned Puck of the Week.
More...
October 14th, 2012
I have seen nearly everything Wes Anderson has ever made and I've liked most of it. I was disappointed by The Darjeeling Limited, but loved The Fantastic Mr. Fox. His latest film is Moonrise Kingdom, a story of young love set in 1965 with an ensemble cast, including two newcomers in the central two roles. It became one of his biggest hits, but was it also one of his best?
More...
September 25th, 2012
The Perks of Being a Wallflower easily topped the per theater chart with an average of $57,090 in four theaters. This combined with its 81% positive reviews suggests a potential for significant expansion and long legs. Diana Vreeland - The Eye Has to Travel was also strong with an average of $21,233. This is an excellent start, but documentaries rarely expand significantly beyond the art house circuit. Occupy Unmasked just managed to top $10,000 on the per theater chart with an average of $10,238 in four theaters.
More...
September 16th, 2012
Resident Evil: Retribution will post a solid opening weekend to top this weekend's box office, according to studio estimates released on Sunday morning. With $21.1 million projected by Sony, it will be the fourth consecutive film in the franchise to open between $20 million and $27 million -- an impressive level of consistency. In second place, Finding Nemo 3D is expected to post about $17.5 million, which is a significant disappointment compared to the $30 million debut enjoyed by The Lion King this weekend last year. But the real plaudits this weekend will go to a film playing in just five theaters.
More...
August 7th, 2012
Celeste and Jesse Forever opened in four theaters and earned just over $100,000 for an average of $26,946. This suggests a strong potential to expand. Killer Joe did expand going from three to fourteen theaters, but its theater average dipped roughly 8% to $11,647. That's an amazing hold and bodes well for the film's future.
More...
July 24th, 2012
The Dark Knight Rises led the way on the per theater chart with an average of $36,532, which is excellent for an ultra-wide release. The Queen of Versailles was next with an average of $17,109 in three theaters. This does show some potential to expand, but as a documentary, it likely won't get too far. Space Station bounced back into the $10,000 club with an average of $11,540 in two theaters with Deep Sea 3-D right behind with $10,590 in one theater. The final film to crack $10,000 was The Imposter with $10,202 in its lone theater.
More...
July 17th, 2012
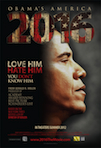
One of two Obama related films topped the per theater chart this past weekend. 2016 earned $31,610 in its lone theater, which suggests potential to earn some measure of mainstream success; however, documentaries rarely get too far. The Imposter earned $22,379, also in one theater. This also suggests some potential, but again, it is a documentary. Easy Money earned an average of $12,342 in two theaters, while Ice Age: Continental Drift was right behind with an average of $12,015.
More...
July 10th, 2012
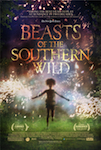
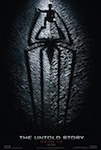
Beasts of the Southern Wild remained on top of the per theater chart with an average $19,687 in 19 theaters. It is very close to its first major milestone and it has a lot of room to grow. The Amazing Spider-man opened in second place with an average of $14,360. Two IMAX films bounced into the $10,000 club. Deep Space 3-D and Space Station earned $13,069 and $11,996 respectively.
More...
July 8th, 2012
The Amazing Spider-Man has continued its strong performance through the weekend, adding another $65 million to the $75 million it accumulated through Thursday. Its $140 million total is ahead of Sony's pre-release prediction, but mostly in line with independent analysis. With only Ice Age: Continental Drift opening next weekend, it will have a clear couple of weeks to pick up the teenage crowd and something over $200 million, before being blown away by The Dark Knight Rises on July 20. The weekend's other two debutantes are less amazing.
More...
July 4th, 2012
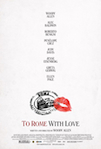
Beasts of the Southern Wild was the latest limited release to have a monster start on the per theater chart. It earned $170,000 in four theaters for an average of $42,426. To Rome With Love was pushed into second place with an average of $23,872 in 29 theaters. Up next was a trio of wide releases starting with Ted with $16,800. Magic Mike and Tyler Perry's Madea's Witness Protection were close behind with $13,354 and $11,749. It's rare for three wide releases to reach the $10,000 mark on the per theater chart.
More...
July 1st, 2012
A huge opening for Ted and better-than-expected starts for both Magic Mike and Tyler Perry's Madea's Witness Protection will add up to an impressive weekend for the industry, based on Sunday's studio estimates. Even with a tough comparison (July 4 fell on a Monday last year), the total for this weekend should be about on par with the same weekend last year.
More...
June 26th, 2012
To Rome With Love topped the per theater chart with an outstanding average of $72,272 in five theaters. While this is an amazing start, there are some reasons to not get too excited. First of all, Moonrise Kingdom opened with more and did so in fewer theaters. Also, Sunday's estimates were a bit higher, so it fell faster than expected over the weekend. Finally, the reviews were split, so it likely won't have as strong legs as some of Woody Allen's films have in the past. The only other film to top the $10,000 mark on the per theater chart was Brave with an average of $15,928. Kumare came very close with $9,601 in one theater over the weekend, while it earned $19,972 from Wednesday through Sunday.
More...
June 19th, 2012
Moonrise Kingdom has been on the top of the per theater chart for close to a month now. The past weekend it managed an average of $12,571 in nearly 200 theaters. Unfortunately for the box office as a whole, it was the only film to reach the $10,000 market. Your Sister's Sister did come close with an average of $8,402 in thirteen theaters, which is good enough to suggest some potential to expand.
More...
June 17th, 2012
What was billed as a potentially tight race at the top of the chart this weekend has turned into a romp for Madagascar 3 thanks in part to a steep second-weekend decline for Prometheus, but mainly to weak openings for Rock of Ages and That's My Boy. Madagascar itself will be down 41% to $35.5 million and a 10 day total of $120.4 million, which is a fairly sizable decline for a family movie at this time of year. Prometheus is set to decline 60% to $20.2 million this weekend, for $88.9 million so far. Rock of Ages will be third with $15 million for the weekend, which leaves it far short of its $75 million budget. That's My Boy will most likely end up in 5th place with $13 million, which may prove to be Adam Sandler's worst opening weekend ever, once adjusted for ticket price inflation.
More...
June 12th, 2012
For the third weekend in a row, Moonrise Kingdom remained the top film on the per theater chart with an average of $16,247. Again, most limited releases would kill to have an opening week per theater average that high while playing in only a couple theaters. Moonrise Kingdom did it in its third weekend of release while playing in nearly 100 theaters. To call it a success is an understatement. Prometheus finished in second place with $15,032, while the overall box office leader, Madagascar 3: Europe's Most Wanted, was right behind with an average of $14,166. Dark Horse opened with $13,551 in its lone theater. Safety Not Guaranteed opened in ninety theaters, which is a little high for a limited release, but it still earned an impressive average of $10,862.
More...
June 10th, 2012
This is a rare Summer weekend where two new releases had a decent shot at topping the chart, and a rarer Summer weekend where both of them have performed strongly at the box office. In the end, Madagascar 3: Europe's Most Wanted will come out on top, according to studios' Sunday estimates, with the animated adventure forecast to earn just over $60 million (within 5% of the debut of the previous outing for the franchise). Prometheus, meanwhile, started out in first place on Friday, but has slowed through the weekend and will end up with about $50 million, according to Fox. Both films averaged about $14,000 per theater, and clearly didn't suffer too much from having to share 3-D space in theaters.
More...
June 5th, 2012
Moonrise Kingdom remained on the top of the per theater chart with an outstanding average of $54,805 in 16 theaters. If it had opened with that average in four theaters, it would have been considered a huge hit, so this is a fantastic sophomore stint. Snow White and the Huntsman was the only other film in the $10,000 club with an average of $14,900.
More...
June 3rd, 2012
After a disastrous start for Battleship a few weeks ago, Universal execs will be breathing a lot easier this morning thanks to an impressive debut for Snow White and the Huntsman. The fantasy adventure is projected to earn $56.26 million, according to the studio's Sunday estimate, which will give it a good shot at matching its production budget (which reportedly ended up at more than $170 million).
More...
May 30th, 2012
To call Moonrise Kingdom's opening impressive would be an understatement. The film earned more than $500,000 in just four theaters for an average of $130,749. ... I looked up three different sources to make sure that wasn't a typo. That's the ninth best per theater average of all time, and the best for a live action film. (Disney used to release the animated tentpole releases in one or two theaters for a prestige release a week before their wide releases and these films fill the top eight spots.) Les Intouchables placed second with an average of $25,263 in four theaters, which is excellent and suggests potential for expansion. The overall box office leader, Men in Black 3, was the final film in the $10,000 club with an average of $12,851.
More...
May 27th, 2012
The Avengers vice-like grip on the top reaches of the box office chart will finally be loosened, according to studio estimates released on Sunday. Men in Black 3 is set for a 3-day haul of about $55 million according to Sony Pictures, which will comfortably give it the crown over Avengers' fourth weekend $37 million. The superhero pic will pass $500 million in the process and set a new record as the fastest film to reach that landmark, ahead of Avatar's 32 days.
More...
May 25th, 2012
It should be a strong week on the limited release front. Not only are there a number of releases, but four of them are earning overwhelmingly positive reviews. Granted, not all four of them have a great shot at mainstream success. OC87 is earning perfect reviews so far, but it is a documentary about a man with mental illnesses, and that screams art house circuit. Oslo, 31 August is earning nearly perfect reviews, but it is a Norwegian film and those movies don't have a large built in audience, not even on the art house circuit. The Intouchables has made $300 million internationally and French films do have a built in audience, at least compared to other foreign language films. Moonrise Kingdom has amazing reviews, a proven director, and an impressive ensemble cast. If I were a betting man, I would put money on this movie.
More...
May 1st, 2012

There's good news / bad news going forward into May. First the bad news, April was really weak. It was weak compared to the previous month and weak compared to last year. For the first time all year, we had losses for a month on the year-over-year comparison. As for the good news... it could have been worse? Maybe there wasn't good news with regards to April, but there is certainly good news going forward. Every weekend in May has at least one film with the potential to hit $100 million, while there are a couple that could hit $200 million, and one that, pie in the sky, could reach $400 million. That one film is The Avengers, or as it is officially called, Marvel's The Avengers. I guess they don't want people reminded of the 1998 TV adaptation. While there are four films that should reach $100 million, there are only three other films opening wide, maybe two, maybe four. (More sources have Chernobyl Diaries opening wide than in limited release, but it is not a sure thing either way. Meanwhile, the opposite is true for LOL.) Additionally, there are a couple films opening in limited release this month with a real potential to expand wide: The Best Exotic Marigold Hotel and God Bless America. By comparison, last year had no film reach $300 million, but it had five films reach $100 million. If we are going to earn the win this year, we need strength from the top.
More...