November 8th, 2011
The DVD sales chart returned to normal, at least what passes for normal as we witness the decline of DVD sales. There were not a lot of new releases to chart, but at least the best of them was able to move a lot of units. Captain America: The First Avenger was dominant earning first place with 726,000 units / $12.56 million.
More...
November 1st, 2011
The top of the DVD sales chart was the weakest it's been since August, as Bad Teacher was the number one selling DVD with just 265,000 units sold and $4.71 million in opening week revenue.
More...
October 26th, 2011
Despite the presence of four new releases in the top ten on the Blu-ray sales chart, none were able to overtake The Lion King for top spot. It sold an additional 496,000 units generating $12.39 million for totals of 2.03 million units / $57.86 million after two weeks of release.
More...
October 25th, 2011
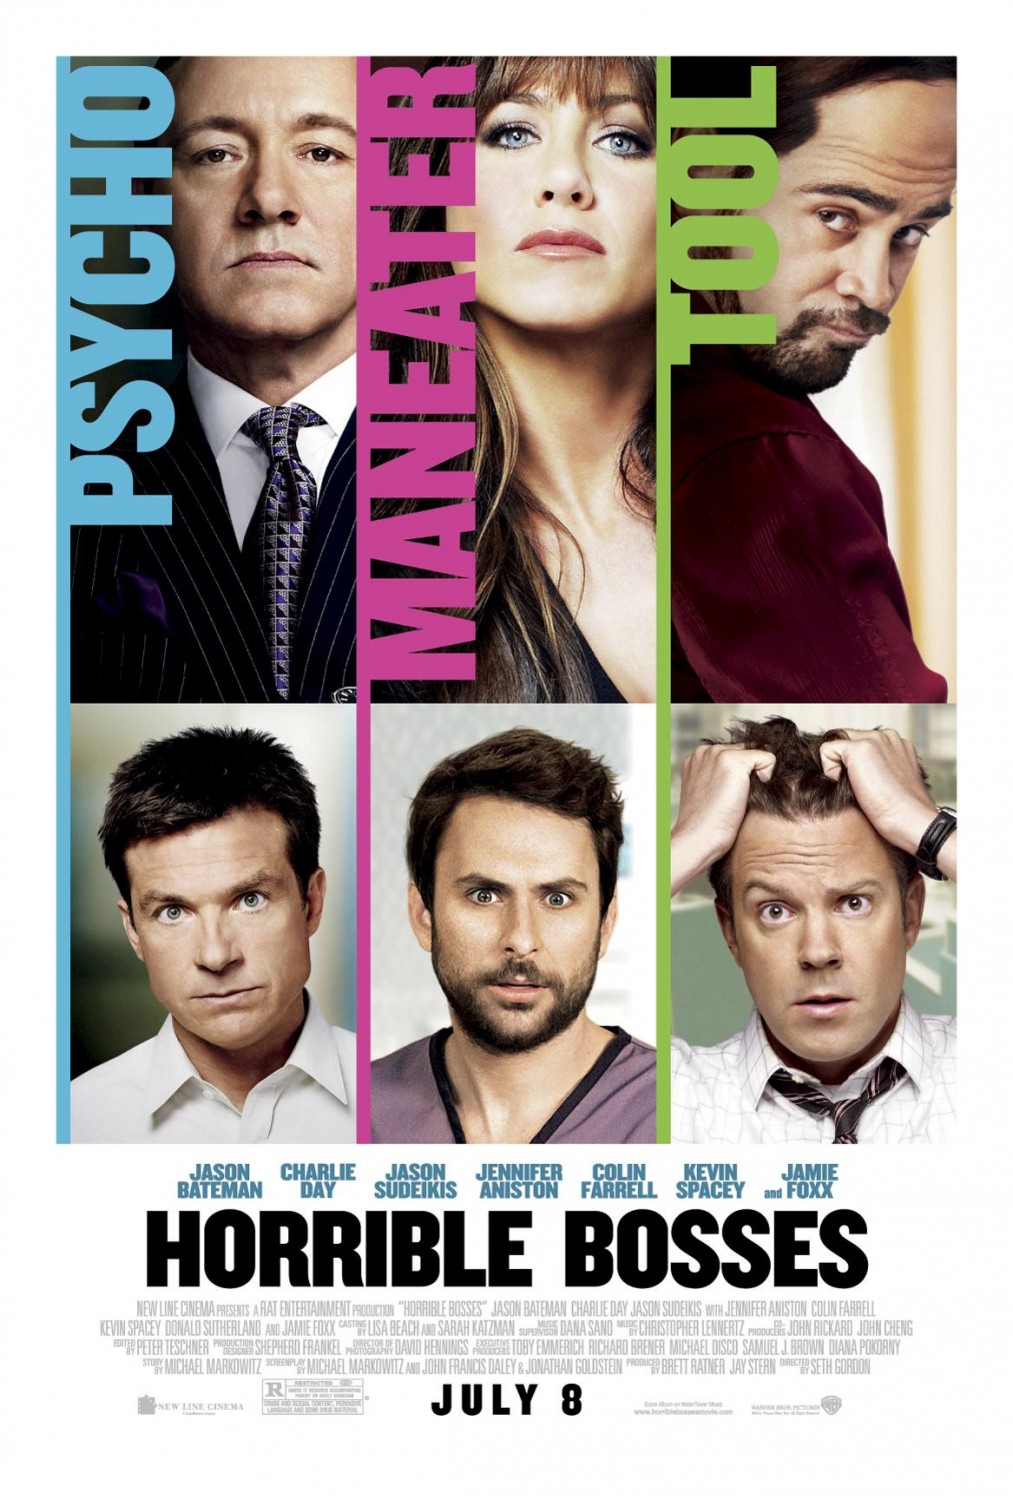
The top of the DVD sales chart was the weakest its been in more than a month and no new release was able to top 500,000 units sold. Horrible Bosses came the closest with 451,000 units / $6.89 million.
More...
October 12th, 2011
It's not a particularly strong week on the home market. The biggest first run release coming out this week is Horrible Bosses, which was a surprise $100 million hit. Green Lantern will likely be the best selling release of the week, but it disappointed with critics and at the box office. As far as the best of the best goes, The Tree of Life Blu-ray / DVD Combo Pack is the best bet as far as Pick of the Week goes, bu there are a few others that are worth picking up. There are also a couple of late arrivals that deserve honorable mentions this week: Castle: Season Three and Dumbo - Blu-ray Combo Pack.
More...
August 8th, 2011
It seems summer is still around as the box office was stronger than expected. Not only did Rise of the Planet of the Apes earn more than last year's number one film, The Other Guys, by a large margin, but the rest of the box office was also able to gain ground on 2010. Granted, with a total haul of $167 million, it was down 7% from last weekend. But more importantly, it was up by 26% from last year. Year-to-date 2011 has pulled in $6.68 billion, which is still 5% lower than this point last year, but we are closing the gap and if the fall is as strong as the summer was, we could still squeeze out a win.
More...
July 25th, 2011
The weekend race at the box office turned out to be not quite as close as expected with Captain America: The First Avenger running away with things. Fortunately, while Harry Potter and the Deathly Hallows, Part 2 fell a little faster than expected, the overall box office was a little stronger than expected. It still fell 27% from last weekend, but a 30% decline would not have been surprising here. Compared to last year, the weekend total of $191 million was 17% higher, while the gap between 2011 and 2010 has close from just over $600 million to just over $400 million in roughly ten days. Revenue is still down by 6%, while ticket sales are close to 8% lower, but if we can end summer less than $300 million off 2010's pace, we might be able to close the gap entirely by the end of the year.
More...
July 21st, 2011
This weekend the battle will be between the last Harry Potter movie and The First Avenger. As long as the two films are close, the box office should be strong. In fact, The Deathly Hallows, Part 2 could break the record for largest week-to-week drop off (in terms of raw dollars) and still top last year's number one film. As long as Captain America comes close and Friends with Benefits doesn't bomb, we should see strong growth on a year-over-year basis.
More...
July 19th, 2011
After a weak start, 2011 started to improve in late April. However, by June it had all fallen apart again and it looked like the summer of 2011 would be even worse than the summer of 2010, which was the worst summer in a decade. Thank goodness Harry Potter and the Deathly Hallows, Part 2 came along. That film made more than the entire box office did last weekend and came within $10 million of doing the same in comparison to last year. It helped the overall box office reach $262 million, or 68% more than last weekend and 47% more than the same weekend last year. 2011 is still off 2010's pace by more than 7% at $5.85 billion to $6.30 million, but at least there's some hope for the near future.
More...
July 14th, 2011
This week is all about Harry Potter and the Deathly Hallows, Part 2, although I know at least a couple of people who are more interested in seeing Winnie the Pooh. Potter will dominate the box office in a way rarely seen and help boost overall box office substantially. In fact, there is a chance it will make more than the entire top ten did the same weekend last year. As long as it doesn't miss low end expectations, it should help give 2011 a much needed win.
More...
July 11th, 2011
Transformers: Dark of the Moon led the way for the second weekend in a row and overall the top five films were a little stronger than expected, but sadly that wasn't enough for 2011 to score a win. It didn't even come close. The overall box office was just $156 million, which was 23% lower than last weekend, but the post-holiday slump mostly explains that. However, it was 19% lower than the same weekend last year and there's no excuse for that. The bad news continues as 2011 has fallen more than $500 million behind 2010's pace, while attendance is just down close to 10%. Unless Harry Potter and the Deathly Hallows, Part 2 is an exceptional hit at the box office, the summer of 2011 could have the worst ticket sales in more than a decade.
More...
July 10th, 2011
Transformers: Dark of the Moon became the highest-grossing movie of the year so far, according to Paramount's Sunday estimate. Its total gross of $261 million is a comfortable $11 million ahead of The Hangover 2, which itself passed $250 million this weekend. While it couldn't come close to topping the chart, Horrible Bosses had a good weekend, earning a shade over $28 million and beating Zookeeper for 2nd place. The Kevin James comedy, meanwhile, posted a decent $21 million.
More...
July 7th, 2011
While there are two wide releases coming out this week, it seems unlikely that either of them will seriously challenge Transformers: Dark of the Moon for top spot at the box office. In fact, it's more likely that Horrible Bosses and Zookeeper combined won't make as much as Dark of the Moon will make this weekend. The new releases are certainly weaker than those from last year and there's no hope any film will make more than Despicable Me did during its opening weekend. Worse still, June 2011 sold the fewest number of tickets for any June since the year 2000; we really can't afford another slow week at the box office, but that's likely to be exactly what we are going to get.
More...
June 28th, 2011

July starts with one of the most important holidays of the year, which is good news for the industry, as June was a little weaker than expected, at least on average. None of the films were shockingly bad at the box office, even if a few missed early predictions by significant degrees. But conversely, none really shocked analysts with their box office prowess. As such, 2011 continued to slide a little further behind 2010's pace, a trend the movie industry hopes will end this month. Fortunately, that is a reasonable goal. Last July was home to two $100 million movies, two $200 million movies, and a one $300 million movie, assuming you count The Twilight Saga: Eclipse as a July film. This time around, we could see two films top $300 million, assuming you count Transformers: Dark of the Moon as a July release. Meanwhile, there are several potential $100 million films. I count up to six films with a statistically significant shot at reaching the century mark, but I would be amazed if more than half of them got there.
More...