March 15th, 2011
The top selling title on this week's sales chart depends on how you categorize the biggest new release of the week. Since the studio considers the Bambi release as a Blu-ray, Megamind was able to repeat on top with 733,000 units during its first full week of release, lifting its totals to 1.66 million units and $10.25 million.
More...
March 14th, 2011
Another exhaustingly slow week. It seems like forever since there was a week with two or more top-tier releases. There is one film that was a hit both at the box office and with critics, The Fighter, while most of the rest failed to succeed in both areas and during a normal week many would have not even been worth mentioning. That said, The Fighter would have been a contender for Pick of the Week even if the competition was stronger than average and the DVD or the Blu-ray / DVD Combo Pack is worth grabbing.
More...
March 12th, 2011
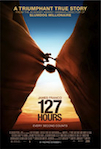
From the very first moment this film was given the green light, 127 Hours was considered an Oscar contender. It is based on a harrowing real life story, which Awards Season voters tend to love. Danny Boyle's previous film won eight Oscars. While the star, James Franco, is one of the hottest young actors around and many think it is just a matter of time before he wins his first Oscar. In the end, it was shut out on Oscar night; however, there's a huge gap between going zero for six at the Oscars and being a disappointment. In fact, my only concern going in was having expectations that were too high.
More...
February 28th, 2011
It is an amazingly slow week on the home market with no first run releases that did well enough to be considered midlevel hits. That is if you don't count Megamind, which came out on Friday. There are a few that are worth picking up, but only one is a real contender for Pick of the Week: Bambi on Blu-ray / DVD Combo Pack.
More...
February 26th, 2011
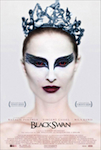
Independent Spirit Award hand out their nominations earlier than the other major awards, but don't hand out the hardware till the day before the Oscars. The long wait ended last night and Black Swan became the big winner sweeping the four categories it was nominated it. It wasn't the only winner of the night, however.
More...
February 20th, 2011
With our annual Oscar Prediction contest underway, now is the best time to look at the nominees and try and figure out who the favorites are and which nominees should just feel honored to be nominated. This weekend we wrap things up and the final category is the most prestigious, Best Picture. With ten nominations, it's a crowded field; however, all but a couple of those are clearly long shots.
More...
February 13th, 2011
With our annual Oscar Prediction contest underway, now is the best time to look at the nominees and try and figure out who the favorites are and which nominees should just feel honored to be nominated. This weekend we will look at the four acting categories, continuing with Best Lead Actor, which is possibly the least competitive of the four acting races.
More...
February 8th, 2011
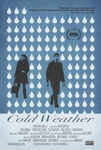
Like last week, only one film reached the $10,000 mark on the per theater chart this past weekend. That film was Cold Weather, which beat my expectations, earning $14,513 in one theater ahead of its VOD demand later this week.
More...
February 6th, 2011
With our annual Oscar Prediction contest underway, now is the best time to look at the nominees and try and figure out who the favorites are and which films should just feel honored to be nominated. Today we look at Best Adapted Screenplay, which is one the categories that I think could give us a surprise. There's a favorite, and one or two that could pull off an upset.
More...
January 30th, 2011
It looks like another slow weekend at the box office, based on studio estimates released on Sunday, but there are some signs of improvement, thanks to a couple of decent openings and some healthy performances by Oscar hopefuls.
The Rite debuted with an estimated $15 million, about in line with expectations, while The Mechanic posted $11.5 million, which is a little ahead of the consensus going into the weekend.
More...
January 25th, 2011
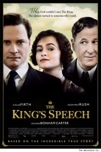
The Oscar nominations were announced this morning, thus ending months of speculation. Along with a (very) few surprises, the list of nominees is mostly a case of Deja Vu. Leading the way, as it has so often this year, was The King's Speech, with 12 nominations, including six in seven of the most prestigious categories (Best Picture, Director, Screenplay, and the four acting categories). But it was far from the only multi-nominated film on the list.
More...
January 4th, 2011
Producers Guild of America announced the nominations in seven categories, three of which are for theatrical releases. Like last year, there was only one repeat nominee, and again like last year, it was a Pixar release.
More...
January 4th, 2011
WGA nominations were announced this week, and there were some strange results, as the guild is sticking to their rules, which resulted in a number of possible Oscar contenders being ruled ineligible. That said, of the non-documentary films, only one hasn't picked up a single nomination previously, so it is hard to say this list is too out there.
More...
January 4th, 2011
The final weekend of the year saw no less than six films topping the $10,000 mark on the per theater chart. Leading the way was Blue Valentine with an average of $48,432 over the weekend and it already has close to $300,000 in just four theaters since Wednesday. Country Strong saw its average grow to $20,753, but it was still pushed to second place due to the competition. Another Year opened in third with $18,645 in six theaters, while Somewhere remained steady with $17,302 in eight. The Illusionist grew by 20% to $15,472, but it did have an extra day, as last weekend it opened on Saturday. The final $10,000 film was The King's Speech, which earned more than $7 million in 700 theaters for an average of $11,108.
More...
December 17th, 2010
The SAG nominations were handed out this week, and while there were a couple of interesting notes, overall there was a decided lack of surprises. The King's Speech and The Fighter led the way with four nominations each, while Black Swan and The Kids Are All Right were right behind with three. All four have been considered Awards Season players for a long time, so their success with SAG merely confirms that and is not shocking in the least.
More...
December 14th, 2010
The Hollywood Foreign Press Association announced their nominations early this morning, and there are some interesting surprises included in the mix. Leading the way was The King's Speech, which has long been seen as one of the major players this Awards Season. Meanwhile, The Fighter and The Social Network were right behind with six each. There were many, many other films nomination, including more than a few shocks. ... Mostly in one category.
More...
December 7th, 2010
Black Swan beat all expectations during its opening; in fact, it broke records for Fox Searchlight earning an average of $80,212 in 18 theaters. This bodes well for its expansion this Friday. Last week's winner, The King's Speech, earned a very strong second place with an average of $54,086 in six theaters. I Love You, Phillip Morris and All Good Things opened with nearly identical averages of $18,753 and $18,586 respectively. The Salvation Poem reached the $10,000 mark with an average of $13,124 in two theaters, which is unexpected.
More...
December 1st, 2010
The official arrival of winter is still a few weeks away, but Winter's Bone ushered in the start of Awards Season picking up seven Independent Spirit Award nominations. This was the most of any film, with The Kids Are All Right placing second with five.
More...
November 30th, 2010
Oscar hopeful, The King's Speech, took one giant leap forward in its quest to bring home the hardware as it topped the weekend per theater chart with and average of $88,863. You can't vote for a movie you haven't seen, so strong box office numbers usually mean more Awards Season Buzz, which in turn usually means better box office numbers. As it did on the overall box office chart, Tangled had to settle for second place on the per theater chart, but its average of $13,535 is still excellent for a saturation level release. The Legend of Pale Male was very close behind with $12,910 in its lone theater. Rounding out the $10,000 club was Harry Potter and the Deathly Hallows: Part I, with an average of $11,900. This is way lower than last week, but not many films earn an average of more than $10,000 during their second weekend of release while playing in more than 4000 theaters.
More...
November 23rd, 2010
The overall box office leader, Harry Potter and the Deathly Hallows: Part I, also led the way on the per theater chart, pulling in an average of $30,307 in more than 4000 theaters. Last week's winner, Tiny Furniture, was a distant second place, with $16,384 in one theater. Made in Dagenham opened with a disappointing average of $12,521 in three theaters. This should be enough to expand somewhat, but its chances of earning a significant measure of mainstream success took a hit over the weekend. White Material was right behind with an average of $11,538, also in three theaters.
More...
November 16th, 2010
It was a close race for the top of the per theater chart with Tiny Furniture coming out on top with $21,235 in its lone theater. Second place went to 127 Hours with an average of $19,934 in 22 theaters. This bodes well for its chances of expanding.
More...
November 9th, 2010
There were a few limited releases to reach the $10,000 mark on the per theater chart this past weekend. 127 Hours lead the way with an impressive average of $66,213 in four theaters. Fair*Game was well back with $14,154, but it opened in 46 theaters, so this is a much better indicator of its chances to expand. The overall box office leader, MegaMind, was the only other film in the $10,000 club with an average of $11,668, but the second place film, Due Date, came very close with an average of $9,743.
More...
November 7th, 2010
MegaMind posted a solid $47.65 million to top the weekend chart, according to studio estimates released on Sunday.
That's very much in line with the performance of other opening weekends for non-sequels from DreamWorks Animation.
How to Train Your Dragon opened with $43.7 million earlier in the year; Monsters vs. Aliens posted $59.3 million in 2009, and fellow-November-opener Bee Movie scored $38 million back in 2007.
Bee Movie ended up with $126 million in total in the US, and $150 million looks like the minimum benchmark for MegaMind as it looks forward to the lucrative holiday season.
More...
November 5th, 2010
After weeks of waiting for the flood of Awards Season hopefuls to finally come out, it appears the wait is over with no less than three releases that could be vying for Oscars on February 27th of next year. Client 9, 127 Hours, and Fair*Game could all be in contention that night, while the latter two could be competing against each other. On the other hand, the competition could hurt at the box office.
More...