February 28th, 2017
-1-News.jpg)
It is not a particularly long list of new releases this week, but there are several that are must haves. This includes Doctor Strange, which was named Pick of the Week last week. Other contenders for that title include The Gate on Blu-ray, The Raid: Collection on Blu-ray, and Moonlight on Blu-ray. In the end, it wasn’t too hard to select Moonlight as Pick of the Week. However, The Gate does earn Puck of the Week for Best Canadian Release.
More...
February 27th, 2017
-2-News.jpg)
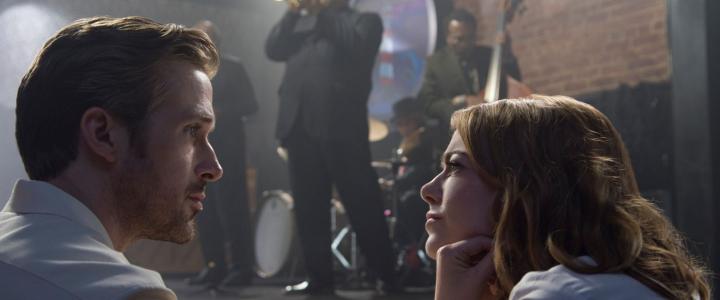
Oscar night turned out to be... interesting at the end. “Interesting” as in “May you live in interesting times.” The big winner of the night was chaos, as there was a mistake with the Best Picture category. (On a side note, I really hope this ends the conspiracy theory that Marisa Tomei didn’t earn her Oscar. Some think her name was announced by accident and they didn’t bother to correct the mistake. They would have obviously corrected the mistake.) On a serious note, Moonlight’s win is amazing. It has likely the lowest budget of the nine Best Picture Nominees and at the moment the lowest box office. That could change with its three wins last night. Additionally, all three wins came from high prestige categories, compared to just two for La La Land. However, La La Land won six Oscars overall, two high prestige, both music categories, and two technical awards, so it too could be seen as the big winner of the night.
More...
February 26th, 2017
It’s Oscar night and we were live blogging the show. Read on the the highlights of what turned out to be a crazy night.
More...
February 26th, 2017

It’s Oscar night and we will be live blogging the show. Before that, let’s take a last look at the nominations with a few annotations. Nominees in italics are those that have received the most votes from our readers so far in our Oscar contest (which is open to new entries until noon, Pacific, today—enter now!). Bold films are those films I think will win. Meanwhile, those that are Underlined are those I want to win. Not all categories have underlined nominees, because not all categories have someone I’m cheering for, or because there are two nominees I couldn’t pick between.
More...
February 26th, 2017
The Independent Spirit Awards winners were handed out last night. While they are rarely a good predictor for the Oscars, Moonlight’s performance was so dominant that its chances of winning Oscars have ticked up a couple of percentage points.
More...
February 24th, 2017
With our annual Oscar Prediction contest underway, now is the best time to look at the nominees and try and figure out who the favorites are and which films should just feel honored to be nominated. Today we look at the final category: Best Picture. It is not a competitive category with an overwhelming favorite, a long shot with a shot, and then rest have maybe a combined 2% chance of winning.
More...
February 23rd, 2017
With our annual Oscar Prediction contest underway, now is the best time to look at the nominees and try and figure out who the favorites are and which films should just feel honored to be nominated. Today we look at Best Director. It is not a particularly competitive category with a favorite, a long shot with a shot, and then everyone else.
More...
February 22nd, 2017
With our annual Oscar Prediction contest underway, now is the best time to look at the nominees and try and figure out who the favorites are and which films should just feel honored to be nominated. Today we look at the two Screenwriting Categories, finishing with Best Adapted Screenplay. This is a harder category to judge, because the consensus favorite, Moonlight, was considered an original screenplay by nearly everyone else.
More...
February 22nd, 2017

With our annual Oscar Prediction contest underway, now is the best time to look at the nominees and try and figure out who the favorites are and which films should just feel honored to be nominated. Today we look at the two Screenwriting Categories, starting with Best Original Screenplay. At one time, La La Land looked to be the favorite, but that no longer seems to be the case.
More...
February 19th, 2017
-3-News.jpg)
The Writers Guild of America are the late major guild group to announce winners before the Oscars. We could see a small change in Oscar chances with a couple of winners tonight.
More...
February 15th, 2017
With our annual Oscar Prediction contest underway, now is the best time to look at the nominees and try and figure out who the favorites are and which films should just feel honored to be nominated. Today we look at Best Supporting Actor. Unlike a lot of other categories, this one could be a real race. We’ve had three previous awards ceremonies and three different winners, one of whom didn’t even get an Oscar nomination. I do have a personal favorite, but I fear my judgment is clouded as a result.
More...
February 15th, 2017
With our annual Oscar Prediction contest underway, now is the best time to look at the nominees and try and figure out who the favorites are and which films should just feel honored to be nominated. Today we look at the Supporting Roles categories, starting with Best Supporting Actress. In this category, we have one overwhelming favorite, a long shot with a shot, and then everyone else.
More...
February 13th, 2017
-1-News.jpg)
It is an interesting week with four top-notch releases. Unfortunately, two of those releases, Doctor Strange and Moonlight, are VOD only. This leaves just two contenders for Pick of the Week: Arrival and The Edge of Seventeen. Both are absolute must haves, but Arrival’s Blu-ray or 4K Ultra HD Combo Pack have far more extras and it is the Pick of the Week.
More...
January 29th, 2017
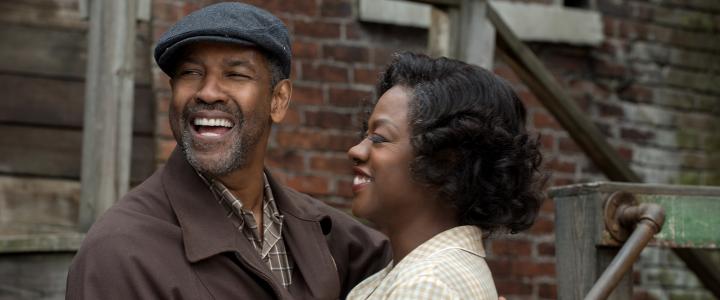
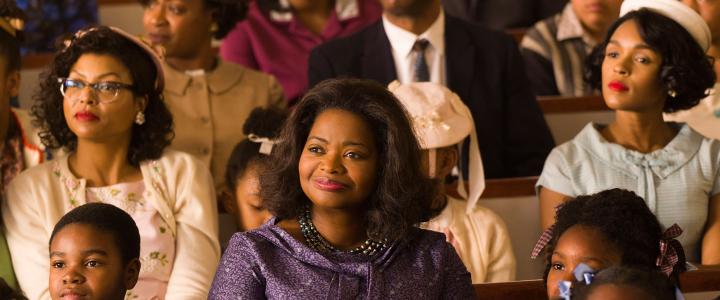
The Screen Actors Guild were handed out tonight and there were a couple of surprises to talk about. There was no one big winner. Hidden Figures won the most prestigious category, but Fences was the only film with multiple wins.
More...
January 24th, 2017
The Oscar nominations were announced starting at 5:18 am Pacific time. Nothing is good that early in the morning. Worse still, it’s a boring year for nominations with very few surprises worth talking about, especially in the biggest categories. Leading the way was La La Land with 14 nominations, tying the record.
More...
January 12th, 2017
-1-News.jpg)
The last of the Directors Guild of America nominations were announced and the Oscars are really shaping up to be a one-movie show. That movie is Deadpool. I’m joking of course, but it did get yet another nomination. At this point, it could earn a Best Picture Oscar nomination and I wouldn’t be surprised. The film that is dominating Awards Season is La La Land and frankly I’ve lost count of the number of nominations it has received.
More...
January 11th, 2017

The Producers Guild of America finally finished announcing their nominations. (They spread out their announcements for reasons I’ve never quite understood.) Most of the films on this list have already earned more than a few previous nominations. We appear to be settling into a predictable Awards Season.
More...
January 11th, 2017
The BAFTA nominations were announced and it should come as no surprise what film lead the way... La La Land with 11 nominations, Nocturnal Animals and Arrival are tied for second with nine nominations a piece.
More...
January 8th, 2017
The first major awards night was Sunday with the Golden Globes being handed out. La La Land led the way with seven wins, winning in every category it was nominated in. This is great news for its Oscar chances, but there’s already backlash building.
More...
January 4th, 2017
The Writers Guild of America is the latest group nominees to be announced. There are a lot of categories that WGA hand out awards, but only three of them are theatrical releases. The list of nominees include several major Awards Season players, like Hidden Figures, but there are also some surprises.
More...
December 14th, 2016
The Screen Actors Guild were the third group to announce their nominations for this awards season. So far there have been three different films earning the most nominations. This could mean the Oscar race will be a lot closer than in past years. This time around Manchester by the Sea led the way with four nominations.
More...
December 13th, 2016
La La Land dominated the per theater chart with an average of $176,221 in five theaters. This is not only the best of the year, it is the second best ever for a live-action film, behind just The Grand Budapest Hotel average of $202,792 in four theaters. Jackie was well back with an average of $18,933 in 26 theaters. Had La La Land not come out this weekend, this would have been big news. Now it might get lost in the crowd. Lion remained in the $10,000 club for the third weekend in a row with an average of $11,224 in 15 theaters.
More...
December 12th, 2016
The Golden Globes nominations were announced and we are starting to see a few names pop up over and over again. La La Land led the way with seven nominations, but Moonlight was right behind with six and Manchester by the Sea earned five. You will be hearing those three names over and over and over again this Awards Season.
More...
December 10th, 2016
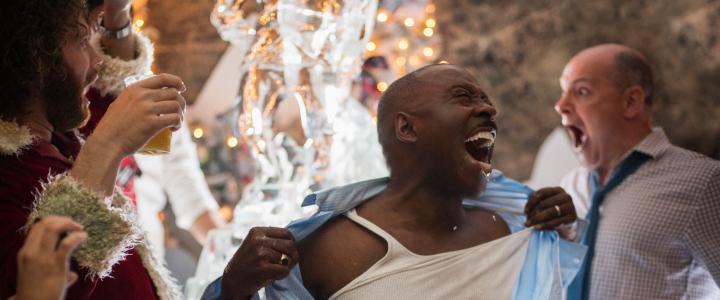
As expected, Office Christmas Party earned first place on Friday with $6.6 million. Its reviews have settled at 44% positive, which is lower than you would like, but fine for this type of release. Likewise, it earned a B from CinemaScore. Neither figure will help its legs, but neither will really hurt them either. By comparison, The Night Before earned $3.56 million during its opening day on its way to a $9.88 million opening weekend. If Office Christmas Party has the same internal multiplier, then it will earn $18.3 million this weekend. However, The Night Before earned 66% positive reviews and an A- from CinemaScore. Office Christmas Party’s weaker performances with critics and audiences will likely result in a lower legs and an opening weekend of just over $17 million.
More...
November 23rd, 2016
Manchester by the Sea led the way on the theater average chart with an average of $64,125 in four theaters. That isn’t the best average we’ve seen this year, but it is fourth place for a 2016 release. Fantastic Beasts and Where to Find Them earned first place on the overall chart and second place with $17,954 on this chart. Nocturnal Animals earned an average of $13,315 in 37 theaters. That’s an impressive average considering how wide it was playing. Best Worst Thing That Ever Could Have Happened earned an average of $11,745 in two theaters. Meanwhile, the re-release of Daughters of the Dust was the final film in the $10,000 club earning $10,842 in its lone theater.
More...
November 23rd, 2016
The Independent Spirit Awards nominations were announced last night and thus the 2016 Awards Season begins. There were a few surprises and some snubs to discuss, but for the most part, there’s not a lot nominations that broke the established narrative. It’s because there isn’t really an established narrative. This means films that earn nominations here have a much better chance of doing well going forward and Moonlight looks like it could rise up as a result.
More...
November 20th, 2016
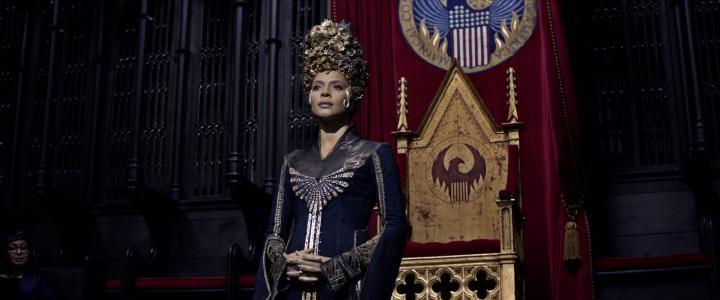
Fantastic Beasts and Where to Find Them is doing everything Warner Bros. could have wished for this weekend, posting a lively $75 million opening in the US, hitting $143.3 million internationally for a global opening over $200 million, and getting a A CinemaScore that should give it positive word of mouth going into Thanksgiving. For a franchise reboot, that’s a lot of reasons to be happy, although its opening is well below the openings enjoyed by the original Harry Potter franchise. The worst of those, Chamber of Secrets, opened with $88 million over three days (Order of the Phoenix and Half-Blood Prince both technically had slower weekends than Chamber of Secrets, but both of them opened on Wednesday, and they still did over $75 million Friday–Sunday).
More...
November 16th, 2016

Billy Lynn’s Long Halftime Walk earned first place on the theater average chart over the weekend earning an average of $57,065 in two theaters. That’s the good news. The bad news is its reviews suggest poor word of mouth and difficulty expanding wide this coming weekend. Elle opened in second place with an average of $25,467, also in two theaters. Loving remained in the $10,000 club for the second weekend with an average of $11,149 in 46 theaters. It still has room to grow. Doctor Strange was right behind with an average of $11,069. The final film in the $10,000 was the biggest new release of the week, Arrival, which earned an average of $10,390.
More...
November 13th, 2016
-1-News.jpg)
While Doctor Strange and Trolls aren’t really being threatened at the top of the chart this weekend, a few healthy new releases are giving Veterans Day weekend a timely boost at the box office. Arrival is the stand-out performer in wide release, with $24 million from 2,317 theaters and an average over $10,000. The sci-fi drama is a critical darling, but is having a harder time with general audiences who might be expecting something with a few more explosions and laser battles, and its CinemaScore is a B. Its potential long-term performance is a therefore a little hard to gauge at this point, but it would be very surprising for it not to pick up a few more theaters, and it might be decent counter-programming to the explosions and laser battles promised by several other films coming up in the next few weeks.
More...
November 8th, 2016
-1-News.jpg)
Loving led the way on the theater average chart this weekend with an average of $39,904 in four theaters. This isn’t among the best of the year, but it does show the film has room to grow and that should help its Oscar buzz, which in turn will help its box office numbers. The overall number one film, Doctor Strange, was next with an average of $21,911. The only holdover in the $10,000 club was Moonlight, which earned an average of $14,883 in 83 theaters. It still has room to grow, but its chances of expanding truly wide are very limited at this point. The Eagle Huntress was next with an average of $13,144 in four theaters. The final film in the $10,000 club was Trolls at $11,473.
More...
November 6th, 2016
-3-News.jpg)
After a couple of months of weak box office, and some very disappointing openings, Doctor Strange, Trolls and Hacksaw Ridge are each, in their own way, putting things back on track. Doctor Strange is grabbing the headlines of course, with an impressive $84,989,000 opening projected by Disney on Sunday morning. That’s almost identical to the opening weekend enjoyed by Thor: The Dark World on this weekend back in 2013, and comes without the benefit of being part of an established franchise (putting aside its place in the Marvel Cinematic Universe).
More...
November 2nd, 2016
Moonlight remained in top spot with an average of $23,614 in 36 theaters. The film has already reached $1 million and it has room to grow. Additionally, its reviews are Oscar-worthy, so its Awards Season buzz should really start to grow. The only other film in the $10,000 club was Gimme Danger, which earned an average of $14,908 in three theaters.
More...
October 30th, 2016

What was meant to be the weekend that the Fall Season started in earnest has turned into a damp squib, with Inferno not just failing to hit expectations, but not even topping the chart. With just $15 million expected this weekend, according to Sony’s Sunday morning projection, the franchise has shown a dismal downward trajectory at the domestic box office. The Da Vinci Code opened with $77 million in 2006; Angels & Demons debuted with $46 million in 2009; and now Inferno will earn less on its opening weekend than either of its predecessors made on their opening days.
The weak opening for Inferno follows a string of so-so results for films over the past couple of months. Perhaps the reality show that is our presidential election is dragging down theatrical business?
More...
October 25th, 2016
Moonlight not only earned the best theater average of the weekend at $100,519 in four theaters, but it had the best average for any film that opened in 2016. It wasn’t the only film to do well this week, as Michael Moore in TrumpLand earned an average of $25,100 in two theaters. The Handmaiden pulled in an average of $18,426 in five theaters, while the re-release of Tanpopo earned $16,410 in one. We are still not done, as the overall number one film, Tyler Perry’s Boo! A Madea Halloween, earned an average of $12,611.
More...
October 23rd, 2016
Hollywood has a habit of underestimating Tyler Perry. When Diary of a Mad Black Woman opened back in 2005, it was expected to struggle to make the top 10, and yet finished top of the chart with a $21.9 million weekend. More than eleven years later, he, or perhaps more accurately, Madea, continues to defy tracking models and rack up wins at the box office, with Boo! A Madea Halloween set to top this weekend’s chart with a projected $27.6 million. That’s nearly $5 million better than the debut of Jack Reacher: Never Go Back, which Paramount has coming in at $23 million.
More...
October 21st, 2016
-1-News.jpg)
Several films coming out this week are earning nearly unanimously positive reviews. This includes a few documentaries, but also a couple of narrative films that have a shot at some box office success. Moonlight is clearly aiming to win awards and it might do so. The Handmaiden should help grow Chan-wook Park’s fanbase here.
More...
.jpg)