July 26th, 2017
The Boss Baby is the biggest release of the week, while Ghost in the Shell is a distant second place. Neither of those films are terrible, but neither are remotely good enough to be a Pick of the Week contender. Gifted was in contention, but in the end, I went with the Criterion Collection release for Lost in America.
More...
July 24th, 2017

At the time of writing this review, Gifted is the biggest limited release hit of the year. (By the time you read the review, it will likely have fallen to second place behind The Big Sick.) On the other hand, its Tomatometer Score was merely good and not great. Did it just get lucky? Or does it deserve its box office success.
More...
May 16th, 2017

Paris Can Wait topped the theater average chart earning nearly $100,000 in just 4 theaters for an average of $24,713. The overall number one film, Guardians of the Galaxy Vol 2, landed in second place with $15,013. The only other film in the $10,000 club was Stefan Zweig: Farewell to Europe, which earned $11,729 in its lone theater. Manifesto just missed the mark with $9,628 also in one theaters. However, it was a Wednesday release and managed $11,824 during its five-day opening.
More...
May 10th, 2017
Not only did Guardians of the Galaxy Vol 2 earn first place on the weekend box office chart, it was also the top film on the theater average chart earning an average of $33,704. This is the fourth best result of the year so far, second best for a wide release. (Beauty and the Beast is still the best of the year with an average of $41,508.) Second place went to the re-release of Stalker with $20,540 in its lone theater. The Lovers was the only other film in the $10,000 club with an average of $16,572 in four theaters.
More...
May 2nd, 2017
-2-News.jpg)
Baahubali 2: The Conclusion opened on top of the theater average chart with $24,712 in just over 400 theaters. It goes without saying that there will be another installment in this franchise; although I hear it won’t follow the same characters. The only other film in the $10,000 club was How to Be a Latin Lover, which earned an average of $10,959 in 1,118 theaters. Obit was relatively close to the $10,000 mark with an average of $8,093 in two theaters over the weekend; however, it was a Wednesday release earning an average of $17,604 over the five days.
More...
April 26th, 2017
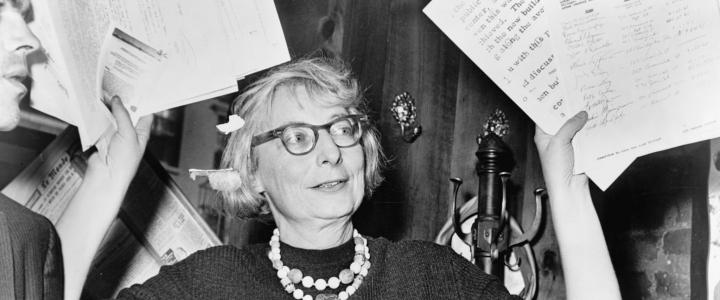
There were only two films in the $10,000 club on this week's theater average chart and both of them were biographical documentaries. Interesting coincidence. Citizen Jane: Battle for the City led the way with an average of $15,726 in two theaters. Meanwhile, Jeremiah Tower: The Last Magnificent just managed to hit the $10,000 mark with an average of $10,134, also in two theaters.
More...
April 25th, 2017

As expected, The Fate of the Furious dominated the weekend box office chart. It held up a little better than expected with $38.41 million over the weekend; however, this was still over 60% lower than its opening weekend and the overall weekend fell over $60 million or 36% from last weekend for a total of $107 million. A lot of the blame can be pushed onto the new releases, as none of them earned a spot in the top five. Born in China was the best of the new releases earning sixth place with $4.79 million. Year-over-year, 2017 was 16% lower than 2016, but fortunately, 2017 still has an impressive $200 million lead over 2016 at $3.53 billion to $3.33 billion.
More...
April 22nd, 2017
The Fate of the Furious dominated the box office chart on Friday with $11.2 million. This could be more than any other film will earn during the entire weekend. That’s the good news. The bad news is this still represents a decline of just over 75% from its opening Friday. This is not good by any stretch of the word, but it is also not unexpected. The film will rebound on Saturday, and earn about $35.5 million over the weekend, according to Universal, which is close to our prediction and will lift the film’s running tally to $160 million. This keeps The Fate of the Furious on pace for $200 million and the film should become the third film released in 2017 to get to that milestone. It might overtake Logan on the yearly chart, but Guardians of the Galaxy, Vol. 2 will probably get there first.
More...
April 19th, 2017

The Lost City of Z led the way on the theater average chart with an average of $27,544 in four theaters. The film is expanding into several hundred more theaters this Friday, so this is a great start. The overall number one film, The Fate of the Furious, was next with an average of $22,920. Norman: The Moderate Rise and Tragic Fall of a New York Fixer opened with nearly $100,000 in five theaters for an average of $19,842. The final film in the $10,000 club was Chasing Trane with $16,626 in its lone theater.
More...
April 18th, 2017
As expected, The Fate of the Furious dominated the box office this weekend, earning nearly a 60% share of the total box office. It did miss predictions, however, with “just” $98.79 million. This is the curse of great expectations. Overall, the box office rose 40% from last weekend, reaching $167 million. However, this was 5.1% lower than the same weekend last year. Had The Fate of the Furious matched expectations, then 2017 would have had a 5% lead over last year. Year-to-date, 2017 has pulled in $3.37 billion and has a 7.2% lead over 2016. That will shrink as last year’s The Jungle Book’s legs will undoubtedly be better than The Fate of the Furious’s legs, but I don’t think 2017 will fall behind 2016 any time soon.
More...
April 16th, 2017

The Fate of the Furious is, as expected, posting great opening numbers domestically, with Universal projecting a $100.2 million opening weekend, but the real news this weekend is the record breaking in international markets. Helped by a gigantic $190 million in China—the biggest-ever three-day weekend in that territory—Fate is headed for an overseas debut of $432.2 million, according to the studio. That’s easily the biggest international weekend of all time, beating Jurassic World’s $316.7 million. It’s also ahead of the inflation-adjusted international opening for Harry Potter and the Deathly Hallows, Part II, which earned $314 million on its first weekend internationally, roughly equivalent to $375 million today.
More...
April 12th, 2017
-1-News.jpg)
Colossal led the way on the theater average chart with an average of $30,057 in four theaters. Meanwhile, Their Finest was the only other film in the $10,000 club with an average of $19,049 also in four theaters.
More...
April 8th, 2017

There was quite a race at the box office on Friday. The Boss Baby led the way with $6.86 million for the day, putting it just ahead of Beauty and the Beast, which made $6.85 million. This is a 56% decline from the film’s opening Friday, which is a little high for a family film. Granted, its reviews are not good, but it did get an A minus from CinemaScore. It should bounce back on Saturday, but a nearly 50% drop-off to just under $26 million is likely at this point.
More...
April 7th, 2017
-1-News.jpg)
It is a busy week for limited releases with more than a dozen titles on this week’s list. This includes a quartet of releases with good reviews and loud buzz. Gifted’s reviews are good, but likely not good enough for limited release. That said, it has a shot at becoming a sleeper hit. Their Finest is a stellar British World War II dramedy, but the cast is more famous in the U.K. than here. Your Name is arguably the best film on this week’s list and it is a monster hit worldwide. However, it is playing in over 300 theaters and that might turn out to be too many. This leaves Colossal as the film with the best shot at mainstream success. Its reviews are not the best, but the combination of reviews, cast, buzz, and commercial viability is.
More...
March 13th, 2017
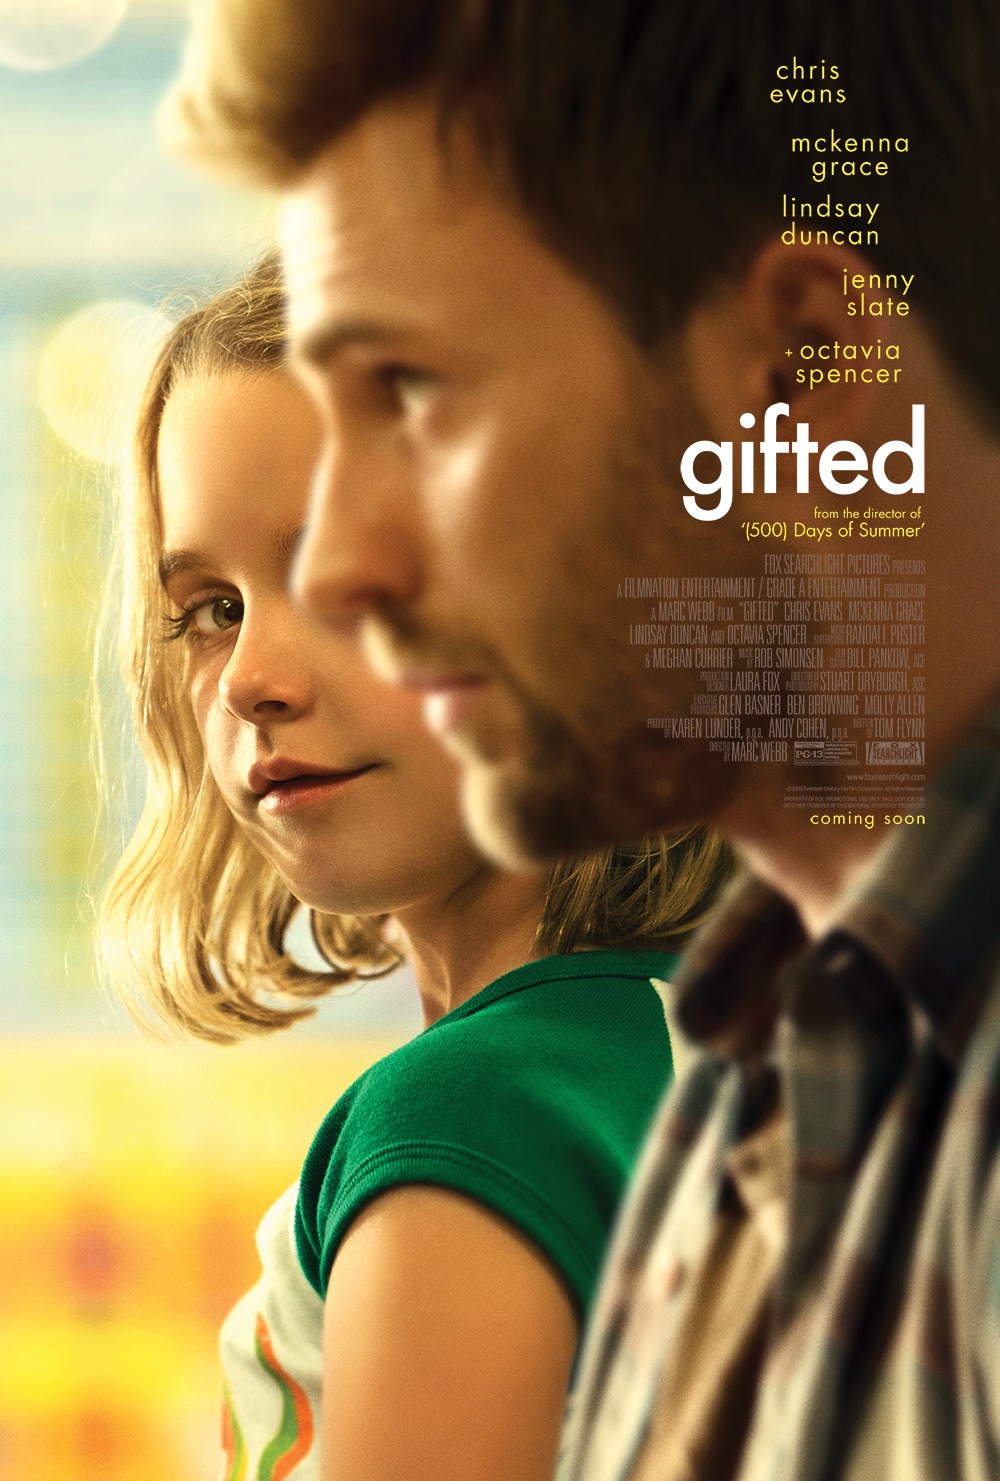
Drama starring Chris Evans, Lindsay Duncan, McKenna Grace, Jenny Slate, and Octavia Spencer opens April 7 ... Full Movie Details.
More...