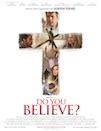
A dozen different souls—all moving in different directions, all longing for something more. As their lives unexpectedly intersect, they each are about to discover there is power in the Cross of Christ … even if they don’t believe it. Yet. When a local pastor is shaken to the core by the visible faith of an old street-corner preacher, he is reminded that true belief always requires action. His response ignites a faith-fueled journey that impacts everyone it touches in ways that only God could orchestrate.
Metrics
Opening Weekend:
$3,591,282 (27.7% of total gross)
Legs:
3.62 (domestic box office/biggest weekend)
Domestic Share:
88.8% (domestic box office/worldwide)
Production Budget:
$2,300,000 (worldwide box office is 6.4 times production budget)
Theater counts:
1,320 opening theaters/1,356 max. theaters, 4.6 weeks average run per theater
Our DVD and Blu-ray sales estimates are based on weekly retail surveys, which we use to build a weekly market share estimate for each title we are tracking. The market share is converted into a weekly sales estimate based on industry reports on the overall size of the market, including reports published in Media Play News.
For example, if our weekly retail survey estimates that a particular title sold 1% of all units that week, and the industry reports sales of 1,500,000 units in total, we will estimate 15,000 units were sold of that title. The consumer spending estimate is based on the average sales price for the title in the retailers we survey.
We refine our estimates from week to week as more data becomes available. In particular, we adjust weekly sales figures for the quarter once the total market estimates are published by the Digital Entertainment Group. Figures will therefore fluctuate each week, and totals for individual titles can go up or down as we update our estimates.
Because sales figures are estimated based on sampling, they will be more accurate for higher-selling titles.
Full financial estimates for this film, including domestic and international box office, video sales, video rentals, TV and ancillary revenue
are available through our research services. For more information, please contact us at research@the-numbers.com.
For a summer week, there's a surprising strength on top of the home market releases. Insurgent will very likely be the top selling DVD or Blu-ray on this week's list, but it isn't even close to the best. There were five contenders for Pick of the Week, three of which were in the TV on DVD category. This includes the eventual winner, Orphan Black: Season Three.
More...
After a couple of soft weeks at the box office, both new wide releases beat expectations. In fact, Home nearly doubled predictions. Get Hard also beat expectations, albeit by a smaller margin. Add in solid runs by the holdovers and the overall box office was very strong at $150 million. This is 19% higher than last week and 7.3% higher than the same weekend last year. We can thank Home entirely for this win. If it had merely matched predictions, 2015 would have lost the in the year-over-year comparisons. Year-to-date, 2015 is ahead of 2014 by a 2.0% margin at $2.37 billion to $2.32 billion.
More...
As expected, Insurgent led the way at the box office; however, it didn't live up to Divergent's opening from last year. Worse still, both The Gunman and Do You Believe? failed to match low expectations. Overall, the box office did dip from last week, but by less than $1 million or 0.5%. Its decline from last year was more troublesome at 7.3%. Year-to-date, 2015 is still ahead of 2014, but by only 2.2% at $2.18 billion to $2.13 billion.
More...
A mix of positive and negative factors (poor reviews vs. fan loyalty, competition vs. Spring break and so on) are neatly canceling one another out this weekend to give Insurgent an opening weekend almost perfectly in line with the $54.6 million debut enjoyed by Divergent this time last year. Lionsgate is officially projecting a $54 million weekend. The numbers we’re seeing suggest the film will end up a shade lower than that—perhaps $53 million would be a safer bet—but either way, it’s an impressive start, and the fifth-best weekend of 2015 so far.
More...
Insurgent leads the three wide releases coming out this weekend. Although that is really an understatement. Insurgent will likely earn more on its opening day than the combined weekend totals of The Gunman and Do You Believe? The real competition for Insurgent is Divergent, which opened this weekend last year with $54.61 million. If Insurgent doesn't at least match that, then the franchise is in trouble going forward. Cinderella should have no trouble earning second place, but how much Insurgent's crossover audience hurts Cinderella will go a long way in determining Cinderella's legs. This weekend last year, Divergent opened and it looks like Insurgent will have no trouble topping that number. Additionally, Muppets Most Wanted opened in second place with $17.01 million and Cinderella should make twice that this weekend. This should give 2015 an easy win over the weekend in the year-over-year comparison.
More...
February was strong thanks to The SpongeBob Movie: Sponge Out of Water and Fifty Shades of Grey, both of which beat expectations. This March could actually be even better, as there are three or four films that have a decent shot at earning $100 million or more. The top film will likely be Cinderella, which has a real shot at $200 million. Insurgent will almost assuredly get beyond the $100 million mark, while Get Hard, Home, and perhaps Chappie will also get to the century mark. Last March, there were four $100 million hits, led by Divergent, which pulled in $150 million. While this March should be better than February, I'm not sure it will be better than last March. I don't think March 2015 will be much worse than last year, but I think its percentage lead will be chipped away at by the end of the month.
More...
A dozen different souls—all moving in different directions, all longing for something more. As their lives unexpectedly intersect, they each are about to discover there is power in the Cross of Christ … even if they don’t believe it. Yet. When a local pastor is shaken to the core by the visible faith of an old street-corner preacher, he is reminded that true belief always requires action. His response ignites a faith-fueled journey that impacts everyone it touches in ways that only God could orchestrate.
Metrics
Opening Weekend:
$3,591,282 (27.7% of total gross)
Legs:
3.62 (domestic box office/biggest weekend)
Domestic Share:
88.8% (domestic box office/worldwide)
Production Budget:
$2,300,000 (worldwide box office is 6.4 times production budget)
Theater counts:
1,320 opening theaters/1,356 max. theaters, 4.6 weeks average run per theater
For a summer week, there's a surprising strength on top of the home market releases. Insurgent will very likely be the top selling DVD or Blu-ray on this week's list, but it isn't even close to the best. There were five contenders for Pick of the Week, three of which were in the TV on DVD category. This includes the eventual winner, Orphan Black: Season Three.
More...
After a couple of soft weeks at the box office, both new wide releases beat expectations. In fact, Home nearly doubled predictions. Get Hard also beat expectations, albeit by a smaller margin. Add in solid runs by the holdovers and the overall box office was very strong at $150 million. This is 19% higher than last week and 7.3% higher than the same weekend last year. We can thank Home entirely for this win. If it had merely matched predictions, 2015 would have lost the in the year-over-year comparisons. Year-to-date, 2015 is ahead of 2014 by a 2.0% margin at $2.37 billion to $2.32 billion.
More...
As expected, Insurgent led the way at the box office; however, it didn't live up to Divergent's opening from last year. Worse still, both The Gunman and Do You Believe? failed to match low expectations. Overall, the box office did dip from last week, but by less than $1 million or 0.5%. Its decline from last year was more troublesome at 7.3%. Year-to-date, 2015 is still ahead of 2014, but by only 2.2% at $2.18 billion to $2.13 billion.
More...
A mix of positive and negative factors (poor reviews vs. fan loyalty, competition vs. Spring break and so on) are neatly canceling one another out this weekend to give Insurgent an opening weekend almost perfectly in line with the $54.6 million debut enjoyed by Divergent this time last year. Lionsgate is officially projecting a $54 million weekend. The numbers we’re seeing suggest the film will end up a shade lower than that—perhaps $53 million would be a safer bet—but either way, it’s an impressive start, and the fifth-best weekend of 2015 so far.
More...
Insurgent leads the three wide releases coming out this weekend. Although that is really an understatement. Insurgent will likely earn more on its opening day than the combined weekend totals of The Gunman and Do You Believe? The real competition for Insurgent is Divergent, which opened this weekend last year with $54.61 million. If Insurgent doesn't at least match that, then the franchise is in trouble going forward. Cinderella should have no trouble earning second place, but how much Insurgent's crossover audience hurts Cinderella will go a long way in determining Cinderella's legs. This weekend last year, Divergent opened and it looks like Insurgent will have no trouble topping that number. Additionally, Muppets Most Wanted opened in second place with $17.01 million and Cinderella should make twice that this weekend. This should give 2015 an easy win over the weekend in the year-over-year comparison.
More...
February was strong thanks to The SpongeBob Movie: Sponge Out of Water and Fifty Shades of Grey, both of which beat expectations. This March could actually be even better, as there are three or four films that have a decent shot at earning $100 million or more. The top film will likely be Cinderella, which has a real shot at $200 million. Insurgent will almost assuredly get beyond the $100 million mark, while Get Hard, Home, and perhaps Chappie will also get to the century mark. Last March, there were four $100 million hits, led by Divergent, which pulled in $150 million. While this March should be better than February, I'm not sure it will be better than last March. I don't think March 2015 will be much worse than last year, but I think its percentage lead will be chipped away at by the end of the month.
More...
Our DVD and Blu-ray sales estimates are based on weekly retail surveys, which we use to build a weekly market share estimate for each title we are tracking. The market share is converted into a weekly sales estimate based on industry reports on the overall size of the market, including reports published in Media Play News.
For example, if our weekly retail survey estimates that a particular title sold 1% of all units that week, and the industry reports sales of 1,500,000 units in total, we will estimate 15,000 units were sold of that title. The consumer spending estimate is based on the average sales price for the title in the retailers we survey.
We refine our estimates from week to week as more data becomes available. In particular, we adjust weekly sales figures for the quarter once the total market estimates are published by the Digital Entertainment Group. Figures will therefore fluctuate each week, and totals for individual titles can go up or down as we update our estimates.
Because sales figures are estimated based on sampling, they will be more accurate for higher-selling titles.
Full financial estimates for this film, including domestic and international box office, video sales, video rentals, TV and ancillary revenue
are available through our research services. For more information, please contact us at research@the-numbers.com.
-2-News.jpg)

-Thumbnail.jpg)
-Thumbnail.jpg)